 Back to Learn page

What Is the Fennel ESG Wheel?
Think of the Fennel ESG wheel as an ESG report card.
Let’s say you want to invest in companies that share your values. You’ve heard about Environmental, Social, and Governance (ESG), and want to incorporate ESG data into your investing strategy. Now, where do you begin?
ESG spans across three main pillars, from how a company affects the environment, to how it treats its employees and communities, and how its leadership runs the organization as a whole. If you take a step back, you’ll realize that there’s a lot of information that goes into each one of these three pillars, and it can be hard to take it all into account.
You want to learn more about a company’s diversity? Are you interested in gender or ethnic diversity? Diversity across all employees or across leadership? What about diversity in the board of directors? What about pay gaps across certain demographics?
It’s easy to get lost in all the data. That’s why we’ve developed the Fennel ESG wheel, giving you an overview of a company’s ESG impact and the ability to dive deeper.
An ESG Report Card
Think about the Fennel ESG wheel as an ESG report card. The wheel measures ESG performance across ten different categories, and then provides a score from 0 to 100 (the higher the score, the better the performance) for each category. It also takes the average of these ten categories to create a total ESG score.
The ten categories on the wheel are meant to highlight important ESG issues that an investor may want to know about. Here’s what they are and what they measure:
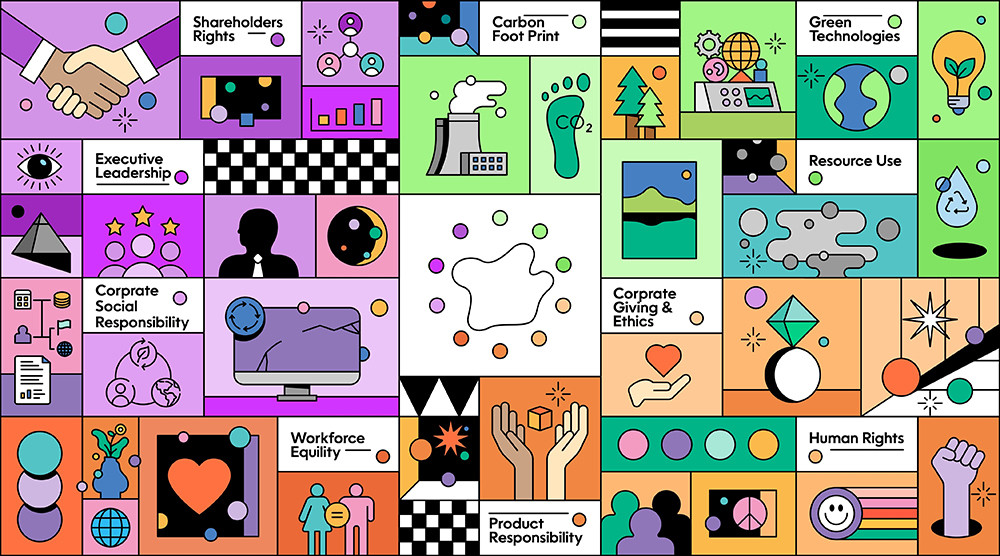
1. Carbon Footprint (Environmental) — the amount of emissions a company puts into the environment, as well as the steps it takes to curb those emissions.
2. Green Technologies (Environmental) — if a company’s products are eco-friendly, and therefore helps customers reduce their environmental impact.
3. Resource Use (Environmental) — how a company uses raw materials, energy, and/or water responsibly, and if it looks for more efficient solutions.
4. Workforce Equity (Social) — things like job satisfaction, workplace safety, diversity, equal opportunities, and professional development.
5. Human Rights Protections (Social) — how a company respects the fundamental rights determined by international human rights conventions.
6. Corporate Giving and Ethics (Social) — if a company operates morally by avoiding fraud, anti-competitive practices, and public health controversies.
7. Product Responsibility (Social) — how a company’s products impact their customers’ well-being or safety.
8. Executive Leadership (Governance) — the diversity of a company’s board of directors, how executives determine their own compensation, and whether there are any controversies among a company’s leaders.
9. Shareholder Rights (Governance) — shareholder voting rights, poison pill and golden parachute policies, and insider dealings controversies.
10. Corporate Social Responsibility (Governance) — how a company incorporates financially-, socially-, and environmentally-ethical practices across its business.
Using the ESG Wheel for a Single Company
Ready to see the ESG wheel in action? Think of a company that you want to learn more about. Then, go to the “Explore” tab in the Fennel app, type in that company’s name in the search bar, and tap on it when you see it come up.
This will pull up the company’s profile page. Scroll down a little bit until you see “ESG Rating” and the ESG wheel.
The ESG wheel has a number in the middle, which represents the company’s total ESG score. This score is calculated using the company’s ESG performance across all ten categories compared to other companies in the same industry. You’ll also see if that company’s ESG data reporting is low, medium, or high compared to other companies.
From there, you have the ability to tap any one of the ten categories to learn about the ESG data relevant to that field.
If you tap the “Carbon Footprint” category you’ll see that company’s emissions targets, total CO2 emissions compared to revenue, e-waste reduction efforts, and the percentage of waste that company recycles. You’ll also see how these numbers compare to other companies in the same industry, and whether that company has high, medium, or low data coverage compared to others. You’ll also see if that company doesn’t report any data for one of these fields.
If you want to explore even further, tap the “i” icon to see all the metrics that are used to calculate that category’s ESG score. Each one of the ten categories includes a lot of data, so we encourage you to explore a bit to see what else you can learn.
Using the ESG Wheel for Multiple Companies
This is a good way to analyze a single company’s ESG data in detail, but what if you want to see ESG data for your portfolio as a whole?
The ESG wheel also appears when you want to look at combined ESG data for multiple companies — whether that’s the companies in your portfolio, a specific ETF, or a watchlist you’ve created. This information is compiled by Fennel, and can help provide insight into ESG performance on a high-level.
If you’ve already invested in multiple companies, you can see what a combined ESG wheel looks like by going to your portfolio. The ESG wheel that appears here will take a weighted average of all the companies you’ve invested in and give you combined ESG scores.
This combined ESG wheel will show you the same ten categories, except instead of comparing the data to companies in a specific industry, it’ll compare that data to the Russell 1000 — a market benchmark that tracks the 1,000 companies in the U.S. that have the largest market cap.
This is helpful if you want a quick temperature check to see if your portfolio or watchlist is more “ESG-friendly” when compared to the rest of the market.
Understanding the Data
While ESG scores can be useful for understanding ESG efforts at a glance, it’s important to understand the data that informs these scores.
Fennel uses ESG data and scores from Refinitiv, which aggregates publicly-disclosed information relevant to ESG performance metrics. These metrics are then used to calculate scores and averages. You can read more about the methodology behind these calculations here.
Because ESG scores are just the tip of the rapidly-melting iceberg, it’s worth taking into account the underlying data if you want to learn more about a company’s ESG performance. By sifting through this data, you may find specific metrics that are interesting to you — like if that company is involved in any child labor controversies or how much the CEO makes compared to the average employee. The ESG wheel may show that a company has a high or low score, but it’s helpful to dig into the data to understand why.
The true value of Fennel’s ESG wheel isn’t the numerical scores it gives you. It’s the ability to have ESG-relevant data that’s easy to comb through and accessible in one place. With this information readily available, it may be easier to start investing in companies that align with your values.

Expand your knowledge further
Beta, enterprise value, expense ratio ... what does it all mean? Here are definitions for the terms you'll see in the Fennel app.

Some brokerages use payment for order flow to generate extra revenue, but at what cost?
How a company acts affects more than just its product or its bottom line, it affects the world around it — for better or for worse
Screening is one way to incorporate ESG into your portfolio.
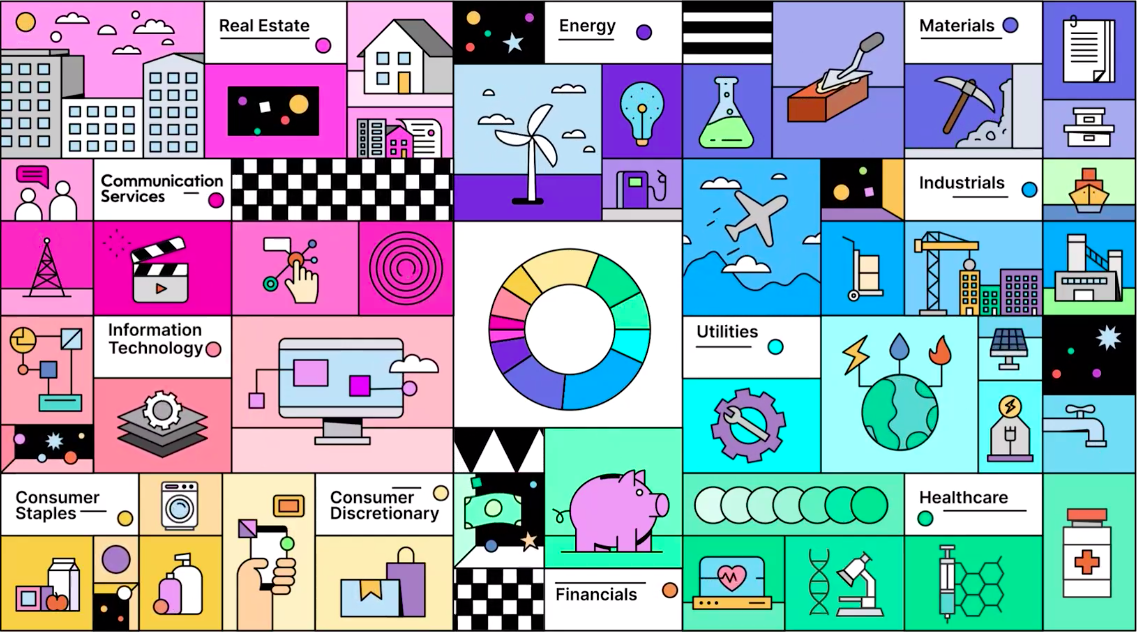
Sectors can help you understand the industry of the companies you invest in.
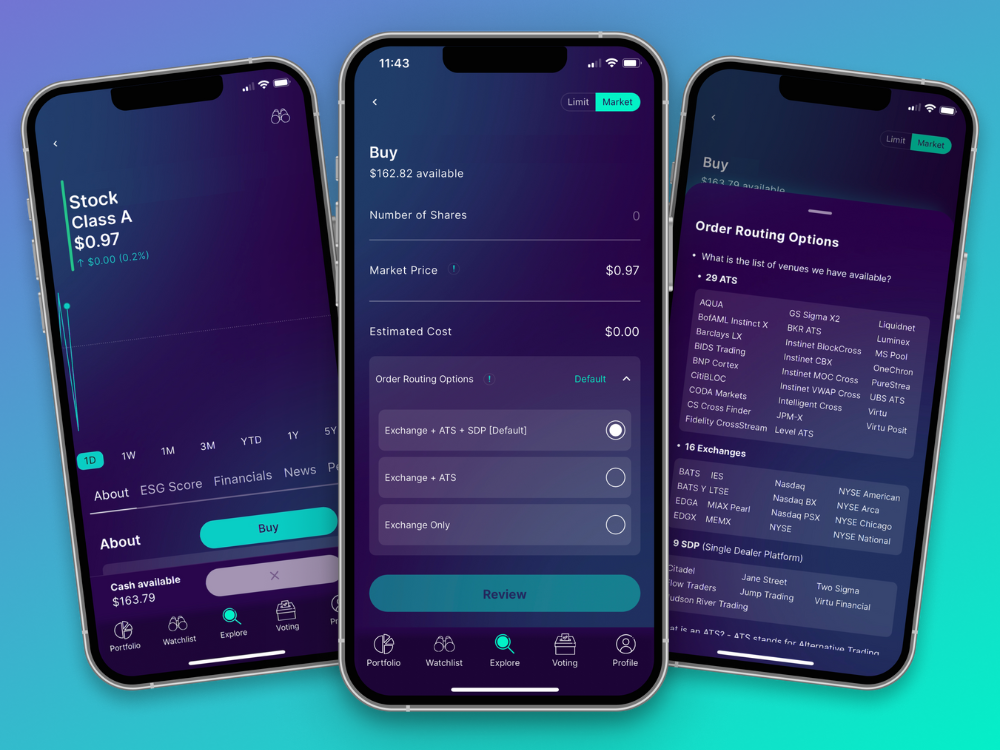
Fennel is giving you even more control over your portfolio by letting you decide how your orders get routed.

If you've ever found yourself nodding along to conversations about investing while secretly wondering if everyone else in the room is speaking a different language, you're not alone.

Think of the Fennel ESG wheel as an ESG report card.

In any market, investors are always looking for the next edge
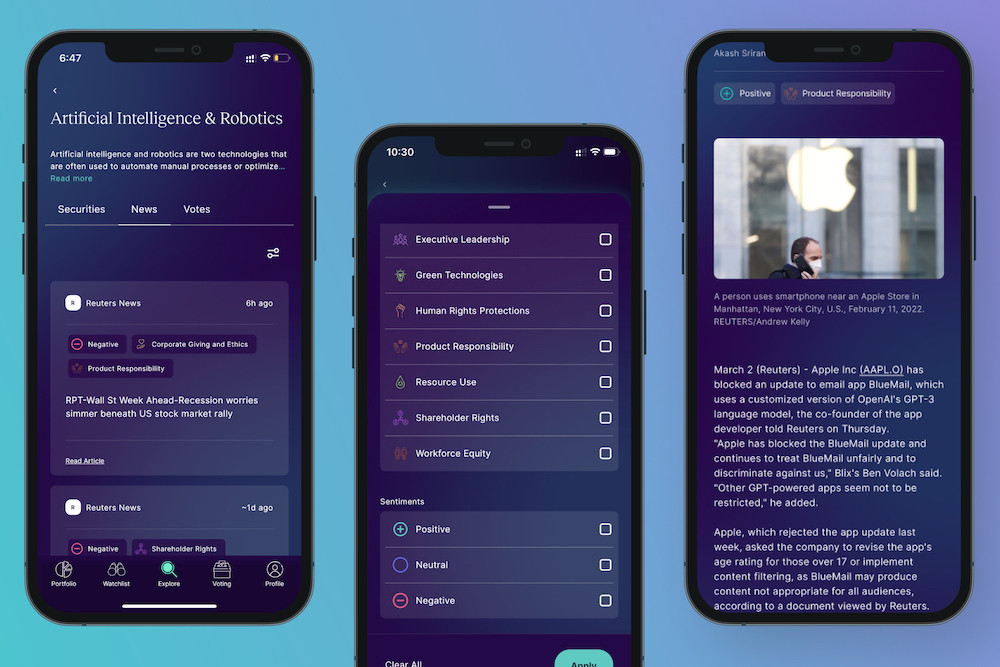
Here's what you should know about Fennel's real-time news feature.
Take back the power of your investment
